Datadog
Spice can be monitored with Datadog using the Spice Metrics Endpoint and pre-built dashboards available in the Spice repository.
Datadog Agent Configuration
Prerequisite: Datadog Agent version 6.5.0 or later is installed.
Configure the Datadog Agent to scrape the Spice metrics endpoint:
- Edit the
openmetrics.d/conf.yamlfile in theconf.d/folder at the root of your Agent’s configuration directory:
init_config:

instances:
  - prometheus_url: SPICE-METRICS-ENDPOINT>/metrics # for example http://localhost:9090/metrics
    namespace: spice
    metrics:
      - '*'
- Restart the Agent to start collecting Spice metrics.
- Refer to Prometheus and OpenMetrics metrics collection from a host for all available configuration options and supported parameters.
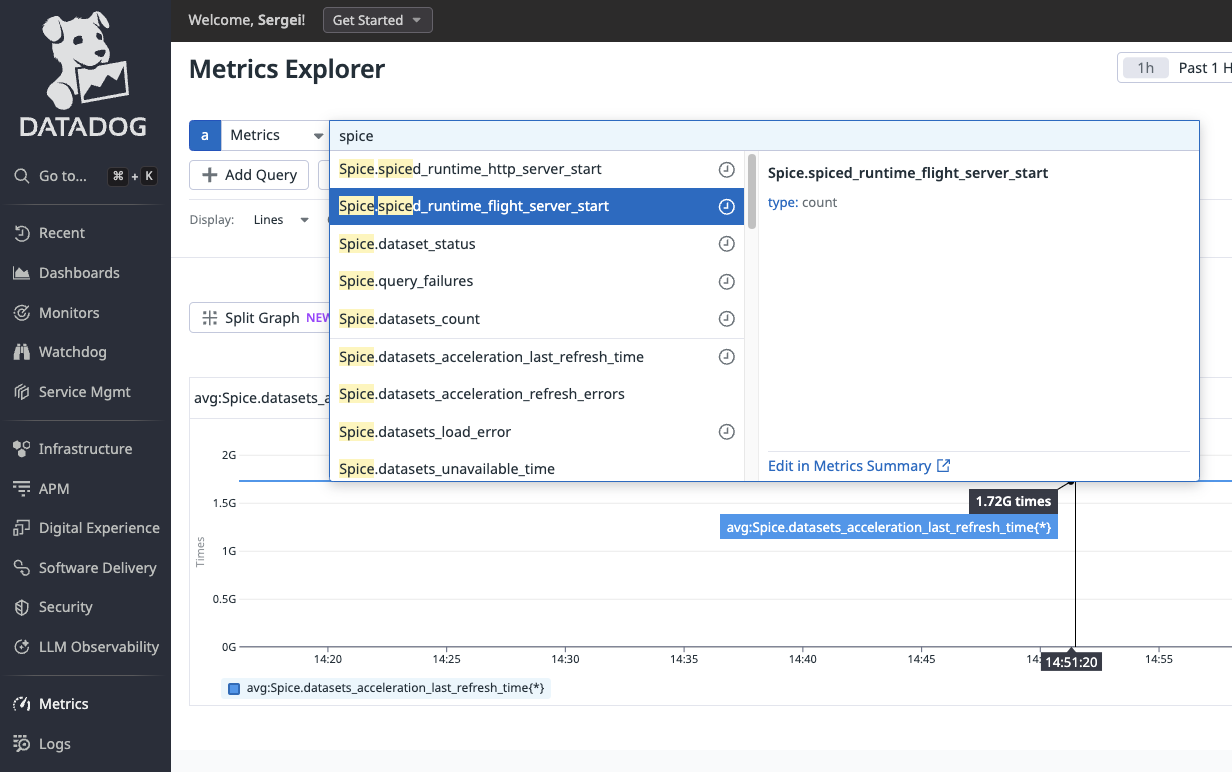
- Open Datadog Metrics Explorer and type
spiceto confirm Spice telemetry information is successfully collected.
Import the Spice Datadog Dashboard
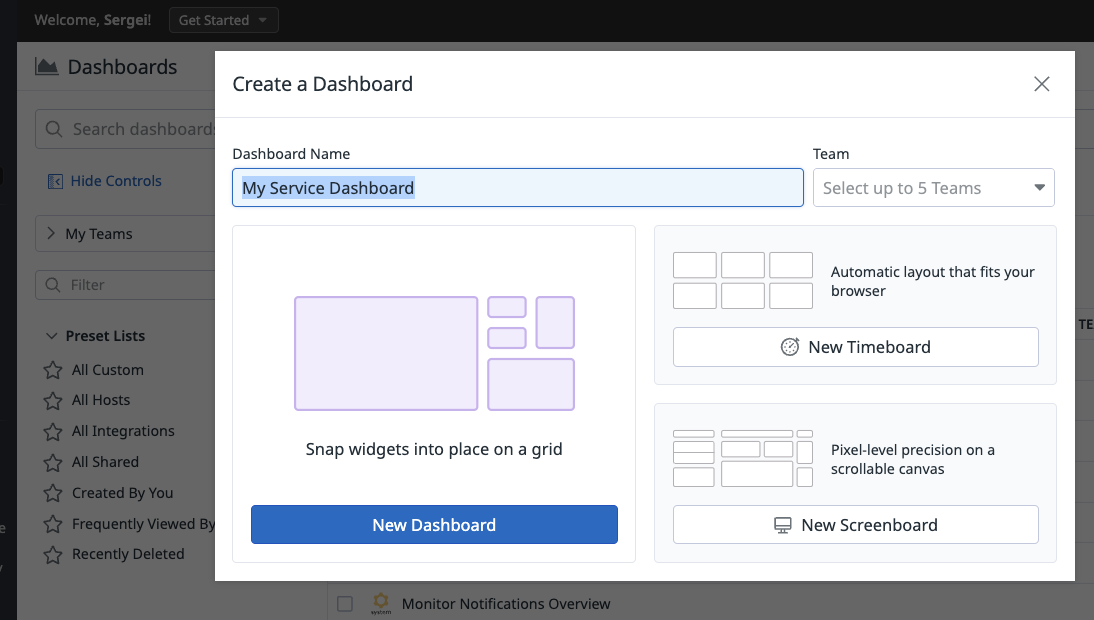
- Create New Datadog Dashboard
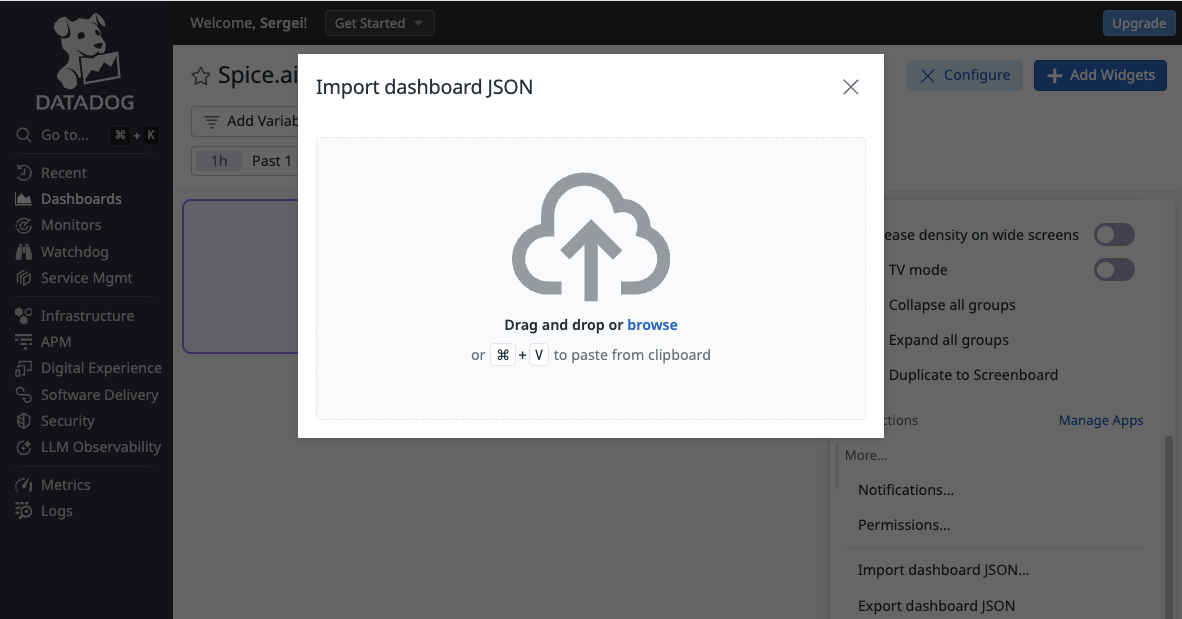
- Click Import dashboard JSON and drag and drop monitoring/datadog-dashboard.json file
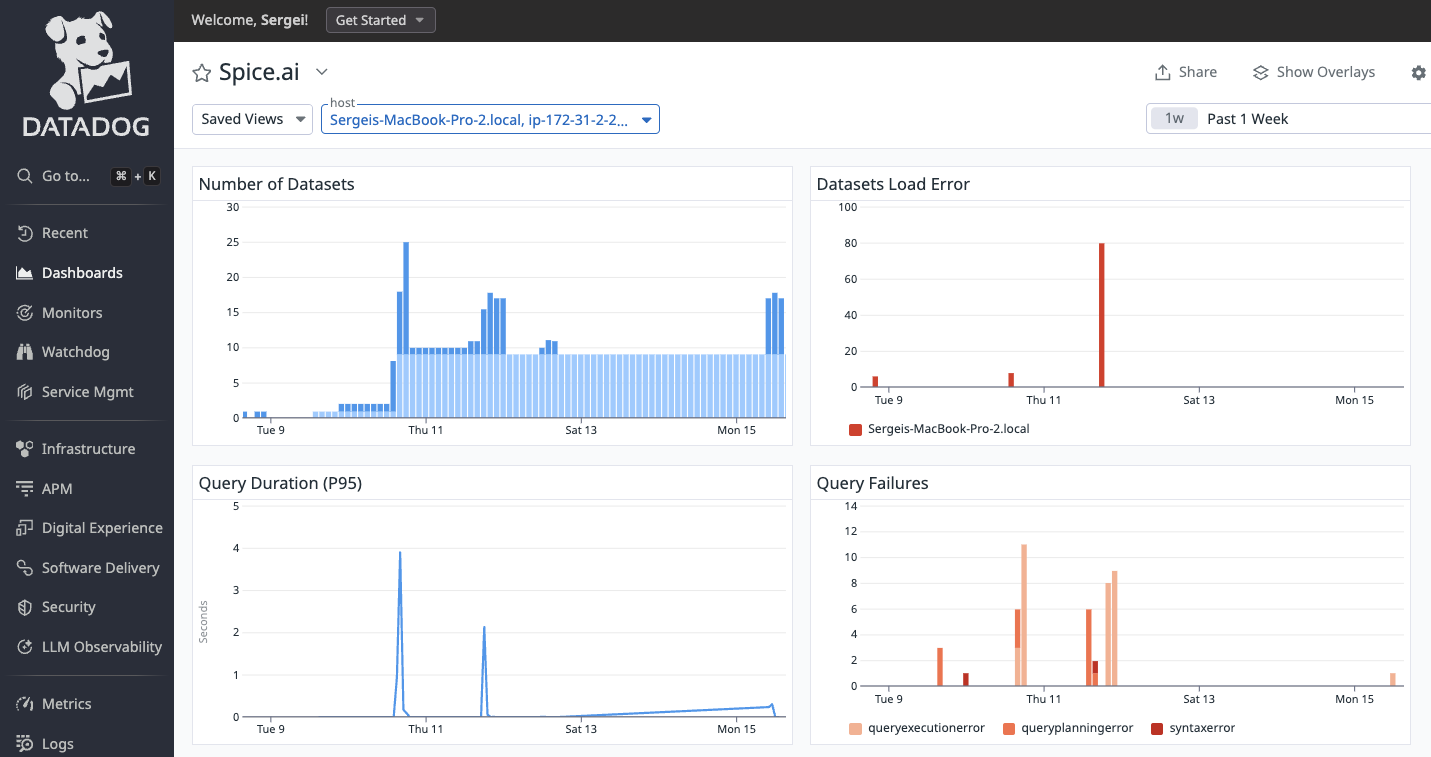
- Dashboard is now configured to display Spice.ai OSS key performance metrics
OpenTelemetry OTLP Export
As an alternative to scraping the Prometheus endpoint with the Datadog Agent, Spice can push metrics directly to Datadog's OTLP Metrics Intake Endpoint over HTTP. This is the recommended approach for agentless deployments (e.g. serverless, ephemeral containers) and for environments where the Datadog API key is managed through Spice's secret stores.
Minimal Configuration
Replace us3 with the Datadog site for the target account (us3, us5, eu, ap1, etc.) and store the Datadog API key in a secret:
runtime:
  telemetry:
    otel_exporter:
      endpoint: https://otlp.us3.datadoghq.com/v1/metrics
      headers:
        DD-API-KEY: ${secrets:DD_API_KEY}
Metrics begin appearing in the Datadog Metrics Explorer within a minute or two.
Namespace Spice Metrics with a Prefix
Use runtime.telemetry.metric_prefix to prepend a string to every exported metric name. This avoids collisions with metrics from other services in the same Datadog account:
runtime:
  telemetry:
    metric_prefix: 'spiceai.'
The runtime metric query_duration_ms is then exported as spiceai.query_duration_ms.
metric_prefix with metric filteringIf you also set runtime.telemetry.otel_exporter.metrics to whitelist specific metrics, the entries must include the prefix. The filter runs after the prefix is applied, so e.g. query_duration_ms will not match when metric_prefix: 'spiceai.' is set — use spiceai.query_duration_ms instead.
Add Custom Tags via Resource Attributes
Attach custom key/value pairs to every metric using runtime.telemetry.properties. Spice sends these as OpenTelemetry resource attributes:
runtime:
  telemetry:
    properties:
      environment: prod
      region: us-west-2
      team: data-platform
For these resource attributes to surface as tags in Datadog, the Datadog OTLP intake also requires the dd-otel-metric-config header with resource_attributes_as_tags enabled (see Datadog OTLP Metrics Intake Endpoint):
runtime:
  telemetry:
    otel_exporter:
      endpoint: https://otlp.us3.datadoghq.com/v1/metrics
      headers:
        DD-API-KEY: ${secrets:DD_API_KEY}
        dd-otel-metric-config: '{"resource_attributes_as_tags": true}'
Datadog typically ingests OTLP metrics within seconds, but the associated tags (from resource attributes) can take noticeably longer to appear in the UI — sometimes several minutes after the first datapoints. The metrics and tags do eventually converge.
Datadog bills on custom metric cardinality, driven by the number of unique tag-value combinations per metric. The custom tags added via runtime.telemetry.properties are typically low-cardinality (environment, region, team), but Spice metrics also carry a number of automatically populated dimensions — for example dataset, protocol, client, client_version, client_system, user_agent, runtime, runtime_version, runtime_system (see Available Metrics) — some of which can grow with the size of the deployment.
Datadog's Metrics without Limits™ decouples ingestion from indexing for exactly this case. With Metrics without Limits™, every tag Spice emits is still ingested, but each metric is configured with one of:
- an allowlist that keeps only the tags actually used in dashboards, monitors, and queries (e.g. keep
datasetandenvironment, drop the rest), or - a blocklist that drops specific auto-populated tags that are not useful for a given metric (e.g. exclude
user_agentorclient_version).
Only the indexed (queryable) tag combinations count toward custom metric billing. Configuration is done per metric in the Metrics Summary page or via the Metrics API, and the in-app UI surfaces an estimated indexed-metric volume before saving and can pre-populate an allowlist from tags actively queried in dashboards, monitors, and notebooks.
Full Example
A complete runtime.telemetry block combining metric prefixing, custom tags, and Datadog OTLP export:
runtime:
  telemetry:
    metric_prefix: 'spiceai.'
    properties:
      environment: prod
      region: us-west-2
      team: data-platform
    otel_exporter:
      endpoint: https://otlp.us3.datadoghq.com/v1/metrics
      headers:
        DD-API-KEY: ${secrets:DD_API_KEY}
        dd-otel-metric-config: '{"resource_attributes_as_tags": true}'
With this configuration, every Spice metric (e.g. spiceai.query_duration_ms, spiceai.query_executions) arrives in Datadog tagged with environment:prod, region:us-west-2, and team:data-platform.
For general OTLP exporter options (push interval, metric filtering, gRPC vs HTTP), see OpenTelemetry Metrics Exporter.
